At the beginning of 2017, a common view among money managers and analysts was that the financial markets would not repeat their strong returns from 2016. Many cited the uncertain global economy, political turmoil in the US, implementation of Brexit, conflicts in the Middle East, North Korea’s weapons buildup, and other factors. The global equity markets defied their predictions, with major equity indices in the US, developed ex-US, and emerging markets posting strong returns for the year.
The broad global advance underscores the importance of following an investment approach based on diversification and discipline rather than prediction and timing. Attempting to predict markets requires investors to not only accurately forecast future events, but also predict how markets will react to those events. The 2017 markets were a good reminder that there is little evidence suggesting either of these objectives can be accomplished on a consistent basis.
Instead of attempting to make predictions about future events, investors should appreciate that today’s price reflects the expectations of market participants and information about future expected returns. The following quote by the late Merton Miller, Nobel Laureate, describes this view:
“Everybody has some information. The function of the markets is to aggregate that information, evaluate it, and get it incorporated into prices.” ―Merton Miller
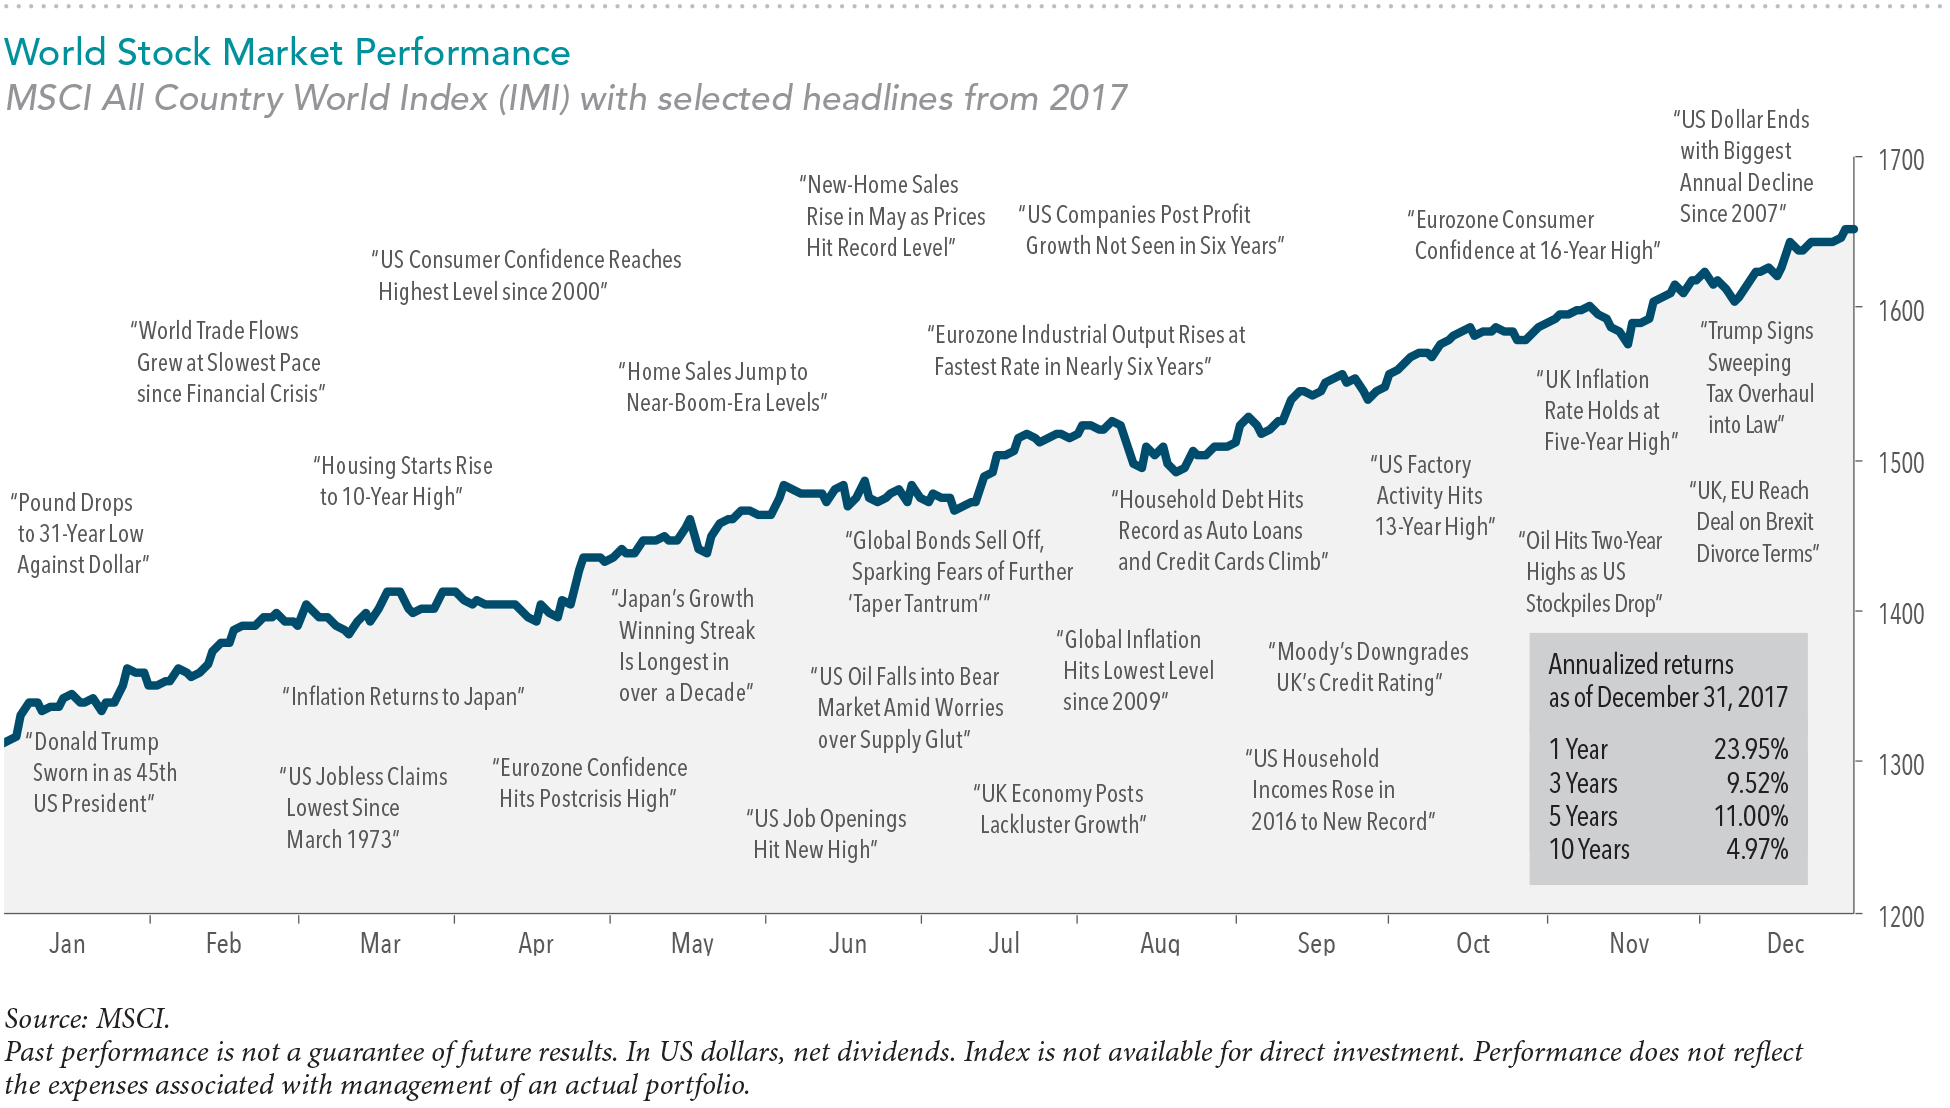
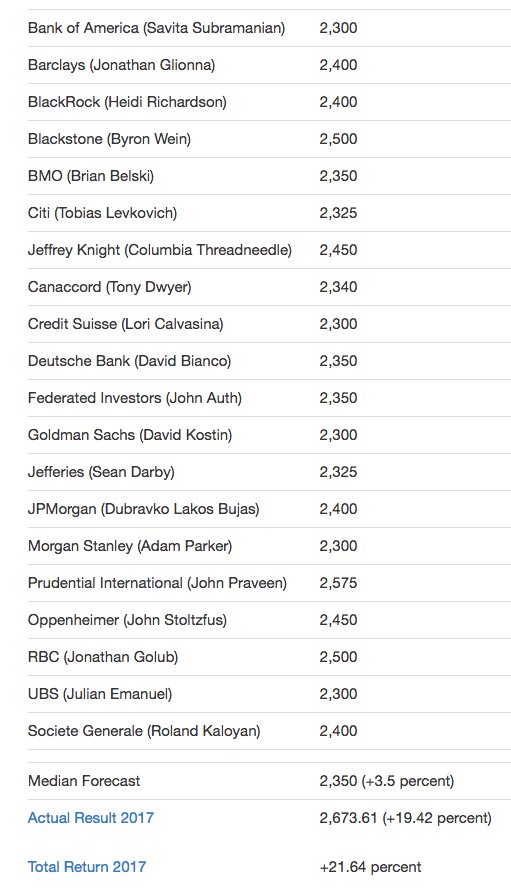
The chart above highlights some of the year’s prominent headlines in the context of global stock market performance as measured by the MSCI All Country World Index-Investable Market Index (MSCI ACWI IMI). These headlines are not offered to explain market returns. Instead, they serve as a reminder that investors should view daily events from a long-term perspective and avoid making investment decisions based solely on the news. Many market forecasters in 2017 were flat out wrong about global market returns. 2017 Forecasts are below.
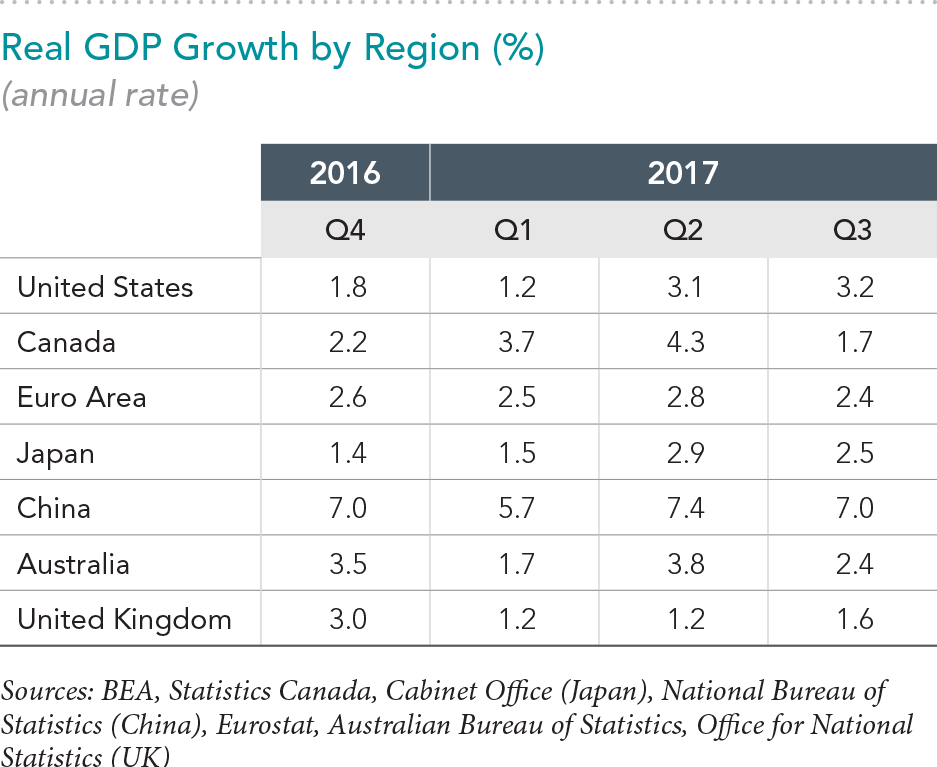
In 2017, the global economy showed signs of stronger growth, with 45 countries tracked by the Organization for Economic Cooperation and Development (OECD) all on pace to expand.[1] Economic outlook and the expected impact on future cash flows are among the many variables markets consider when setting prices. Therefore, investors should remember that growth in the economy is not always linked to stock market performance.
2017 MARKET PERSPECTIVE
Equity Market Highlights
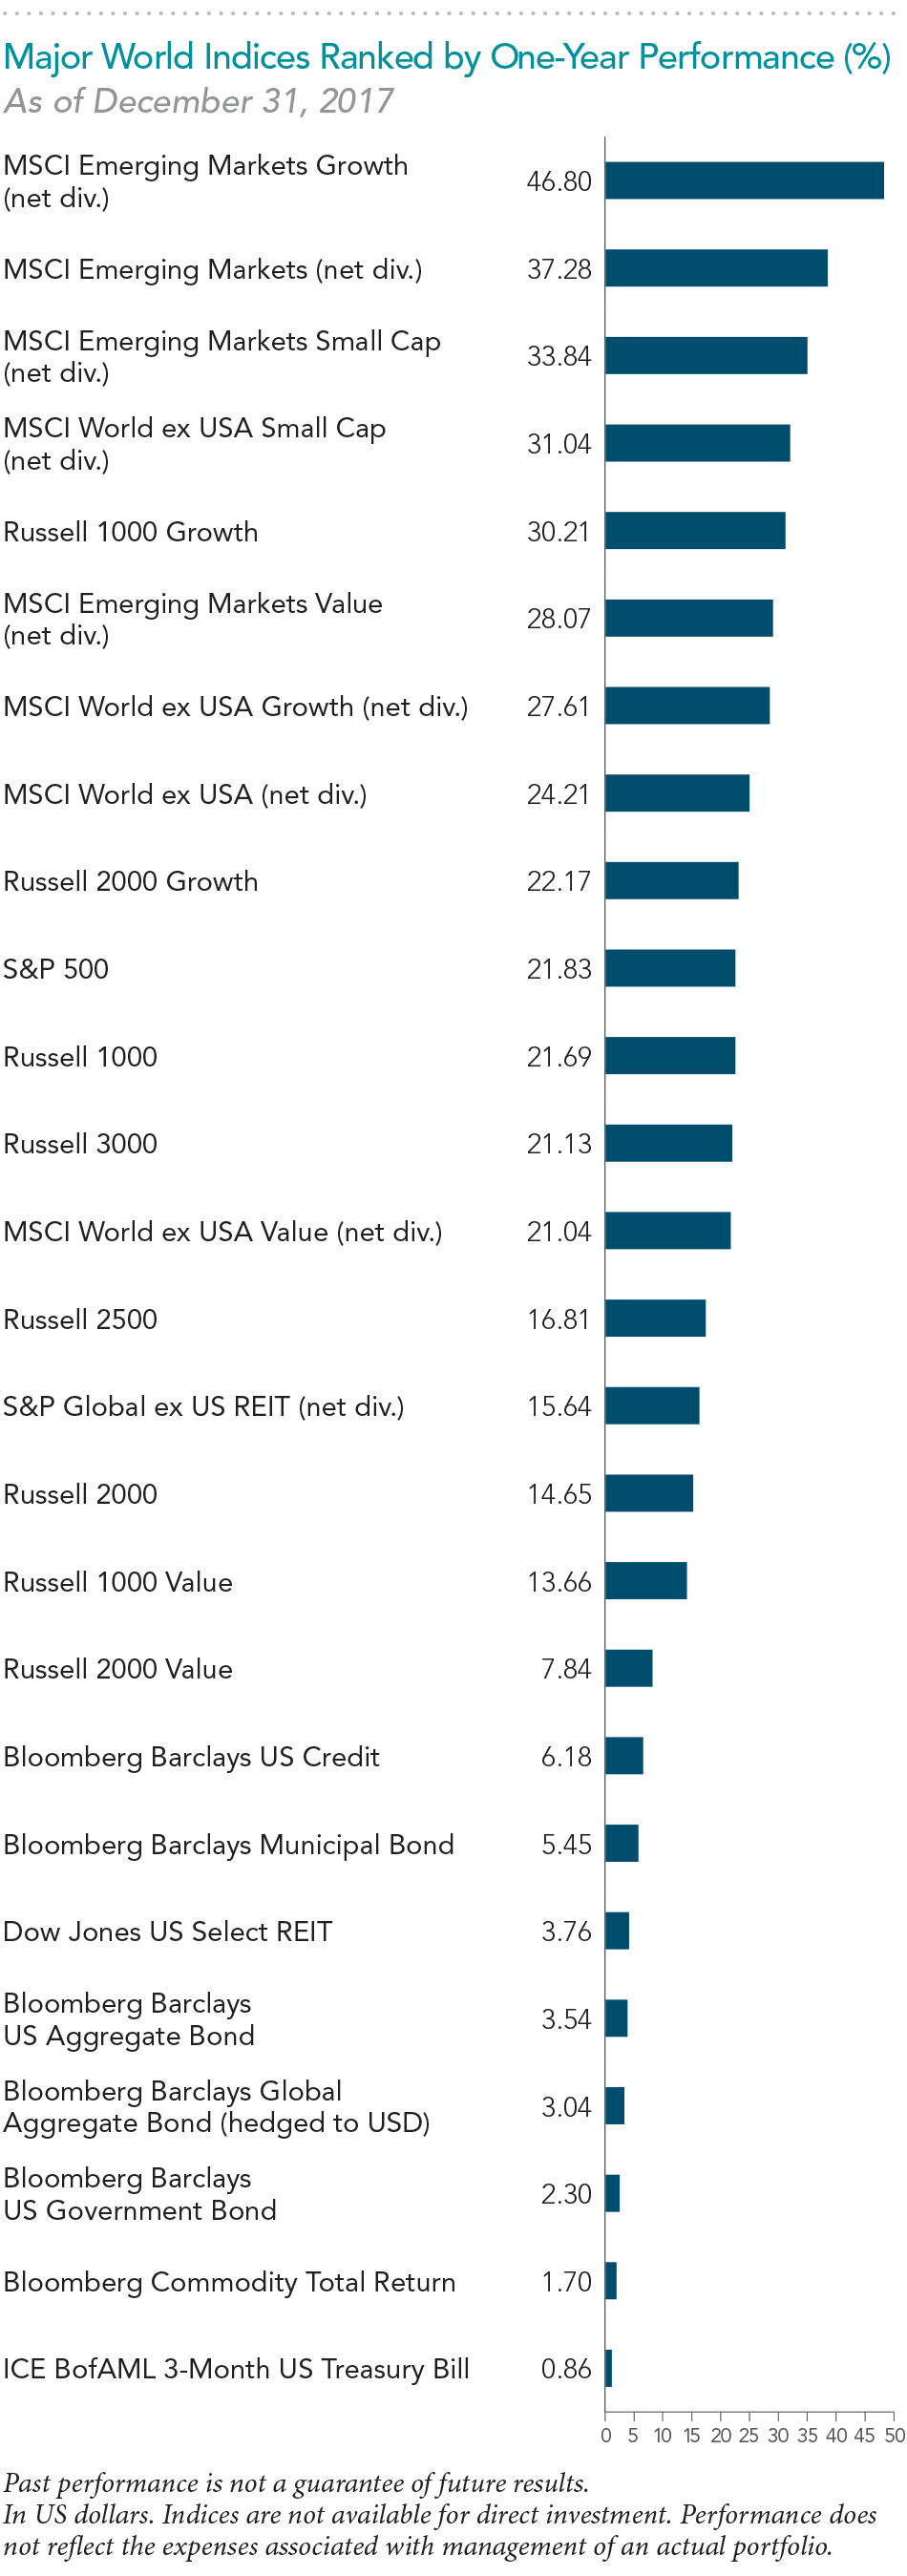
Global equity markets posted another positive year of returns in 2017. The S&P 500 Index recorded a 21.83% total return and small cap stocks, as measured by the Russell 2000 Index, returned 14.65%, both above their long-term average return of 11.96% and 11.73%, respectively, since 1979. 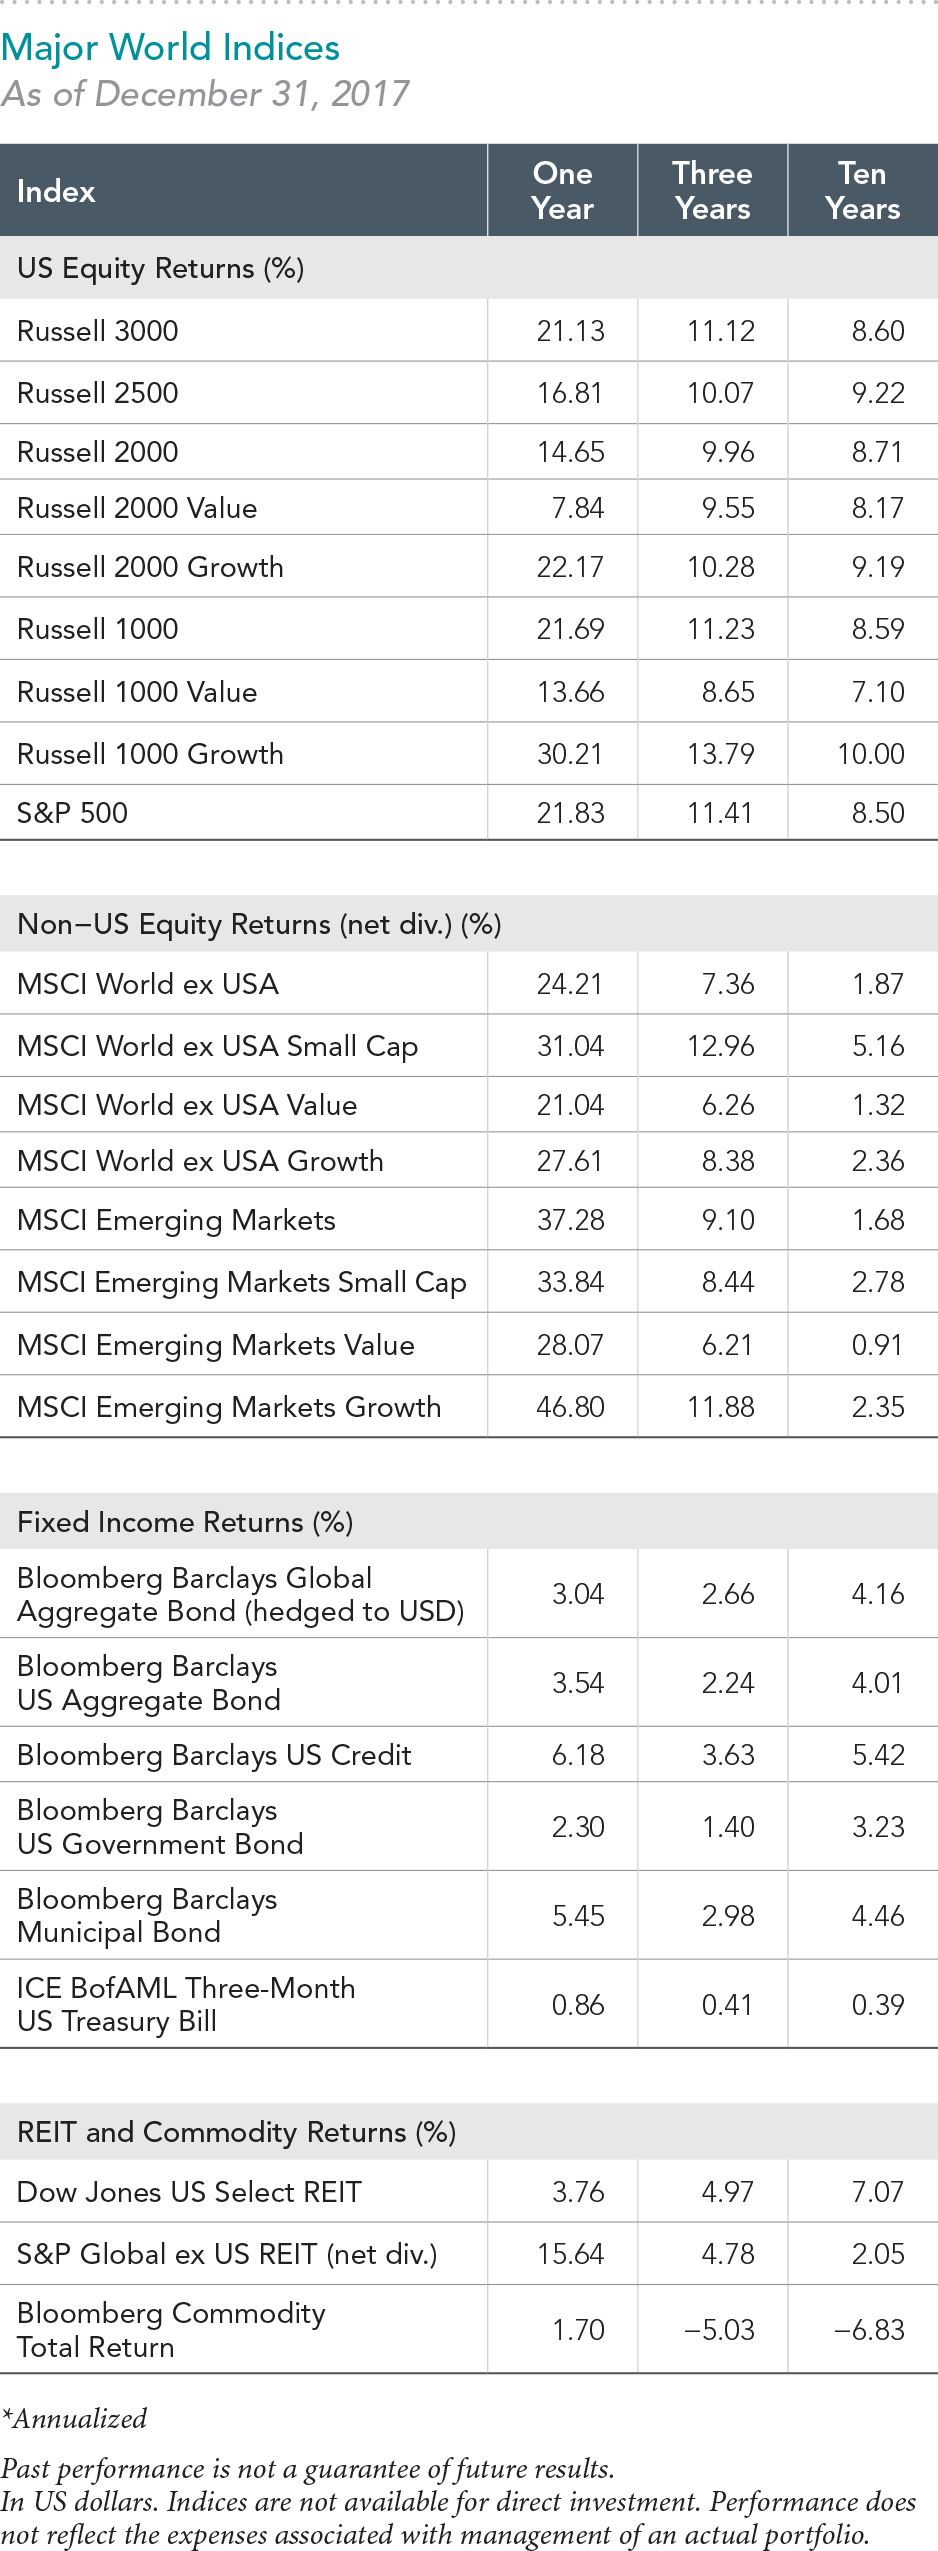
Returns among non-US equity markets were even higher. The MSCI World ex USA Index, which reflects non-US developed markets, logged a 24.21% return and the MSCI Emerging Markets Index a 37.28% return[2], making this the fifth highest return in the index history.
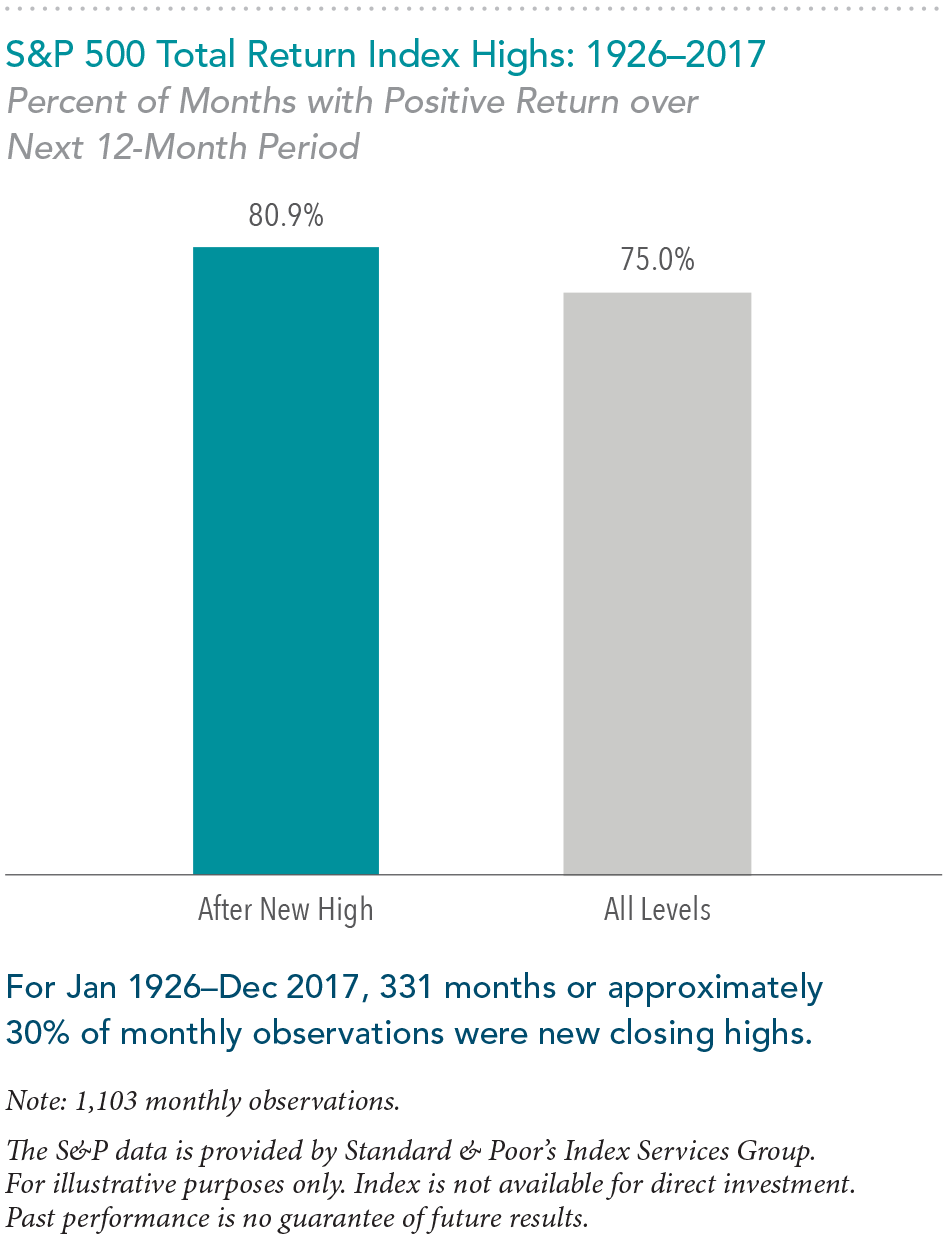
As the S&P 500 and other indices reached all-time highs during the year, a common media question was whether markets were poised for a downturn. History tells us that a market index being at an all-time high generally does not provide actionable information for investors.
For evidence, we can look at the S&P 500 Index for the better part of the last century. From 1926 through 2017, the frequency of positive 12-month returns following a new index high was similar to what is observed following months of any level. In fact, over this time period, almost a third of the monthly observations were new closing highs for the index. The data shows that new index highs have historically not been useful predictors of future returns.[3]
Global Diversification Impact
Developed ex US markets and emerging markets generally outperformed US equities. As a result, a market cap-weighted global equity portfolio would have outperformed a US equity portfolio.
The S&P 500 Index’s 21.83% return marked its best calendar year since 2013 and placed 2017 in the top third of best performing calendar years in the index’s history. Despite these returns, the US ranked in the bottom half of countries for the year, placing 35th out of the 47 countries in the MSCI All Country World Index (IMI).
Delving into individual countries, country level returns were mostly positive. Using the MSCI All Country World Index (IMI) as a proxy, 45 out of the 47 countries posted positive returns. Country level returns were dispersed even among those with positive returns. In developed markets, returns ranged from +10.36% in Israel to +51.39% in Austria. In emerging markets, returns ranged from –24.75% in Pakistan to +53.56% in Poland—a spread of almost 80%. Without a reliable way to predict which country will deliver the highest returns, this large dispersion in returns between the best and worst performing countries again emphasizes the importance of maintaining a diversified approach when investing globally.
China provides an example highlighting the noise in year-to-year single country returns. After a flat-to-negative return (USD) in 2016, Chinese equities returned more than 50% (USD) in 2017, making China one of the best performing countries for the year.
Currencies
Most major currencies including the euro, the Australian dollar, and the British pound appreciated against the US dollar. The strengthening of non-US currencies had a positive impact on returns for US investors with holdings in unhedged non-US assets. This may surprise some investors given that the US dollar has strengthened against many currencies over the past five- and 10-year periods. However, just as with individual country returns, there is no reliable way to predict currency movements. Investors should be cautious about trying to time currencies based on the recent good or bad performance of the US dollar or any other currency.
Premium Performance
In 2017, the small cap premium[4] was generally positive in developed ex US markets and negative across US and emerging markets. The profitability premium[5] was positive across US, developed ex US, and emerging markets, while the value premium[6] was negative across those markets.
US Market
In the US, small cap stocks underperformed large cap stocks and value stocks underperformed growth stocks. On a positive note, high profitability stocks outperformed low profitability stocks as measured marketwide.
Although US small cap stocks, as described by the Russell 2000 Index, provided a healthy 14.65% return in 2017, the US small cap premium (as measured by the Russell 2000 Index minus the Russell 1000 Index) was negative, ranking in the lowest third of annual return differences since 1979. However, over the 10-year period ending December 31, the small cap premium was positive.
US value stocks returned 13.19% in 2017, as measured by the Russell 3000 Value Index. While double-digit returns from value are appealing, US growth stocks performed even better, with a 29.59% return as represented by Russell 3000 Growth Index. The difference between value and growth returns, as measured by the Russell 3000 Value Index minus Russell 3000 Growth Index, made 2017 the fourth lowest year for value since 1979 and pulled the five-year rolling premium return into negative territory.
Even over extended periods, underperformance of the value premium or any other premium is within expectation and not unusual. Over a 10-year period ending in March 2000, value stocks underperformed growth stocks by 5.61% per year, as measured by the Russell 1000 Value and Russell 1000 Growth indices. This underperformance quickly reversed course and by the end of February 2001, value stocks had outperformed growth stocks over the previous one-, three-, five-, 10-, and 20-year periods. Premiums can be difficult if not impossible to predict and relative performance can change quickly, reinforcing the need for discipline in pursuing these sources of higher expected returns.
The profitability premium was positive in 2017, with US high profitability stocks outperforming low profitability stocks. Viewing profitability through the lens of the other premiums, high profitability stocks outperformed low among value stocks while underperforming among growth stocks.
The complementary behavior of premiums in 2017 is a good example of the benefits of integrating multiple premiums in an investment strategy, which can increase the reliability of outperformance and mitigate the impact of an individual premium underperforming, as was the case with value among US stocks in 2017.
In developed ex US markets, small cap stocks outperformed large cap stocks while value stocks underperformed growth stocks. High profitability stocks outperformed low profitability stocks.
Over both five- and 10-year rolling periods, the small cap premium, measured as the MSCI World ex USA Small Cap Index minus the MSCI World ex USA Index, continued to be positive.
Similar to the US equity market, value stocks posted a healthy 21.04% return for 2017 as measured using MSCI World ex USA Value Index. However, growth stocks performed even better with a 27.61% return, as measured by the MSCI World ex USA Growth Index.
The profitability premium was positive in developed ex US markets viewed marketwide. Looking within size and style segments of the market, high profitability outperformed low profitability in all but the large growth segment.
Emerging Markets
In emerging markets, small cap stocks underperformed large cap stocks and value stocks underperformed growth stocks. Similar to the US equity market, high profitability stocks outperformed those with low profitability.
Value stocks returned 28.07% as measured by the MSCI Emerging Markets Value Index, but growth stocks fared better returning 46.80% using the MSCI Emerging Markets Growth Index. The value premium, measured as MSCI Emerging Markets Value Index minus MSCI Emerging Markets Growth Index, was the lowest since 1999.
Though 2017 generally marked a positive year for absolute equity returns, it marked a change in premium performance from 2016 when the size and value premiums were generally positive across global markets. Taking a longer-term perspective, these premiums remain persistent over decades and around the globe despite recent years’ headwinds. It is well documented that stocks with higher expected return potential, such as small cap and value stocks, do not realize these returns every year. Maintaining discipline to these parts of the market is the key to effectively pursuing the long-term returns associated with the size, value, and profitability premiums.
Fixed Income
Both US and non-US fixed income markets posted positive returns in 2017. The Bloomberg Barclays US Aggregate Bond Index gained 3.54%. The Bloomberg Barclays Global Aggregate Bond Index (hedged to USD) gained 3.04%.
Yield curves were upwardly sloped in many developed markets for the year, indicating positive expected term premiums. Realized term premiums were indeed positive both globally and in the US as long-term maturities outperformed their shorter-term counterparts.
Credit spreads[7], which are the difference between yields on lower quality and higher quality fixed income securities, were relatively narrow during the year, indicating smaller expected credit premiums. Realized credit premiums were positive both globally and in the US, as lower-quality investment-grade corporates outperformed their higher-quality investment-grade counterparts. Corporate bonds were the best performing sector, returning 6.42% in the US and 5.70% globally, as reflected in the Bloomberg Barclays Global Aggregate Bond Index (hedged to USD).
In the US, the yield curve flattened as interest rates increased on the short end and decreased on the long end of the curve. The yield on the 3-month US Treasury bill increased 0.88% to end the year at 1.39%. The yield on the 2-year US Treasury note increased 0.69% to 1.89%. The yield on the 10-year US Treasury note decreased 0.05% for the year to end at 2.40%. The yield on the 30-year US Treasury bond decreased 0.32% to end the year at 2.74%.
In other major markets, interest rates increased in Germany while they were relatively unchanged in the United Kingdom and Japan. Yields on Japanese and German government bonds with maturities as long as eight years finished the year in negative territory.
Conclusion
The year of 2017 included numerous examples of the difficulty of predicting the performance of markets, the importance of diversification, and the need to maintain discipline if investors want to effectively pursue the long-term returns the capital markets offer. The following quote by David Booth provides useful perspective as investors head into 2018:
“The key is to have the correct view of markets and how they work. Once you accept this view of markets, the benefits go way beyond just investing money.” –David Booth
Click here to subscribe to my blog or email us for a free 2nd Opinion about your portfolio.
Thanks for reading.
Please Remember: Past performance may not be indicative of future results. Moreover, no current or prospective investor should assume that future performance of any specific investment, investment strategy, or product made reference to directly or indirectly in any general informational materials or educational sessions, will be profitable or equal any corresponding indicated historical performance level(s). Different types of investments involve varying degrees of risk, and there can be no assurance that any specific investment will either be suitable or profitable for an investor’s retirement portfolio. Moreover, you should not assume that any discussion or information contained in this website serves as the receipt of, or as a substitute for, personalized investment advice from Integrity Investment Advisors, LLC and Integrity Investment Advisors, LLC is not providing services in jurisdictions that the firm is not registered or acting under an exemption to registration. To the extent that a reader has any questions regarding the applicability of any specific issue discussed above to his/her individual situation, he/she is encouraged to consult with the professional advisor of his/her choosing.
Sources:
Frank Russell Company is the source and owner of the trademarks, service marks, and copyrights related to the Russell Indexes. S&P and Dow Jones data © 2018 S&P Dow Jones Indices LLC, a division of S&P Global. All rights reserved. MSCI data © MSCI 2018, all rights reserved. ICE BofAML index data © 2018 ICE Data Indices, LLC. Bloomberg Barclays data provided by Bloomberg. Indices are not available for direct investment; their performance does not reflect the expenses associated with the management of an actual portfolio.
Past performance is no guarantee of future results. This information is provided for educational purposes only and should not be considered investment advice or a solicitation to buy or sell securities. There is no guarantee an investing strategy will be successful. Diversification does not eliminate the risk of market loss.
Investing risks include loss of principal and fluctuating value. Small cap securities are subject to greater volatility than those in other asset categories. International investing involves special risks such as currency fluctuation and political instability. Investing in emerging markets may accentuate these risks. Sector-specific investments can also increase these risks.
Fixed income securities are subject to increased loss of principal during periods of rising interest rates. Fixed income investments are subject to various other risks, including changes in credit quality, liquidity, prepayments, and other factors. REIT risks include changes in real estate values and property taxes, interest rates, cash flow of underlying real estate assets, supply and demand, and the management skill and creditworthiness of the issuer.
Dimensional Fund Advisors LP is an investment advisor registered with the Securities and Exchange Commission.
[1] Wall Street Journal, “Everything Went Right for Markets in 2017—
Can That Continue?”, 29 Dec. 2017.
[2] All non-US returns are in USD, net dividends.
[3] Dimensional Fund Advisors, “New Market Highs and Positive Expected Returns,” Issue Brief, 5 Jan. 2017.
[4] The small cap premium is the return difference between small capitalization stocks and large capitalization stocks.
[5] The profitability premium is the return difference between stocks with high relative profitability and stocks with low relative profitability.
[6] The value premium is the return difference between stocks with low relative prices (value) and stocks with high relative prices (growth).
[7] Bloomberg Barclays Global Aggregate Corporate Option Adjusted Spread


Subscribe To Our Blog! We helpClients retire without getting killed in taxes!
Free tools & Checklists! Your Retirement will thank you!
Free & valuable information to help you maintain your lifestyle in retirement. We cover Vanguard indexing, DFA and factor investing (value, small cap, high profit, momentum). Free tools & market insights.
See why you may need a low-cost, fee only Advisor who is a fiduciary for you 100% of the time.
You have successfully subscribed. Thank you! Here are some free resources - Video - A note from your future self - https://youtu.be/HKMYTLyhOGU 5 Free Checklists That May Save You Thousands – Really! Countless people need help in these areas. Checklists include: end of year tax planning, funding a child's college education, caring for aging parents, items to consider before you retire, critical documents to keep on file. Please like & share with family & friends. You can download the PDFs for free. https://www.integrityia.com/5-free-checklists-that-may-save-you-thousands-really/